Since the proclamation of a "Green Deal" by the EU Commission, European agricultural policy has been supporting a gradual shift towards the extensification of agricultural production. The reform of the Common Agricultural Policy (CAP), approved in December 2021, includes measures such as an increase in the area cultivated according to the principles of "organic farming" to 25% of the total agricultural land in the EU (CAP Goal 8), a 20% reduction in the use of fertilizers (CAP Goal 13), and a 50% reduction in the use of "dangerous pesticides" (CAP Goal 6) (EU Biodiversity Strategy Actions Tracker). An important objective of these extensification measures is to "halt and reverse the loss of biodiversity" (Key Policy Objectives of CAP 2023–2027). Indeed, empirical studies have shown that the lower surface area productivity of extensive agricultural systems leads to higher biodiversity in the area under cultivation (Gabriel et al., 2013): the fewer crops on the field, the more wild plants and animals find a habitat there. However, this increase in biodiversity on cultivated land naturally comes with a decrease in production on that land. As a result, the agricultural production area must be expanded if production quantities are to remain constant.
However, from a global perspective, agricultural production levels cannot remain constant in the coming decades: they will need to be significantly increased to feed the growing world population. According to an estimate by the Food and Agriculture Organization of the United Nations (FAO), global food demand is projected to rise by 37% from 2020 to 2050 (Alexandratos and Bruinsma, 2012). If this demand is to be met through extensive agricultural systems, the global agricultural land area will need to be substantially expanded. Currently, 46% of the Earth's inhabitable land area is already used for agriculture (Our World in Data, 2019). A 37% increase in agricultural land area would raise the agricultural land use to 63% of inhabitable land area under the current agricultural systems. Transitioning to extensive agricultural systems would necessitate an even larger expansion of agricultural land. It is very likely that such an expansion would lead to a significant decline in biodiversity. According to estimates by the Intergovernmental Panel on Climate Change (IPCC), habitat loss is already one of the three main causes of species extinction, alongside invasive species and overexploitation (IPCC,2014, Chap. 18, S. 990).
Against this backdrop, a policy that solely focuses on the biodiversity impact of agricultural measures on the area under cultivation appears misguided. In addition to the direct biodiversity effects on the area under cultivation, the indirect biodiversity impact stemming from the land requirements of agricultural policies must also be considered. A comprehensive examination of both effects is necessary to assess the overall biodiversity impact of agricultural policies. In a research paper recently published in the peer-reviewed journal Land Use Policy by Elsevier (journal ranking), I have developed a mathematical evaluation approach that consistently captures both effects, enabling a complete comparison of the biodiversity impact of different agricultural systems based on empirical data.
The starting point of the evaluation approach is the addition of the direct and indirect biodiversity effects of an agricultural system. The direct effect is seen in the biodiversity in the area under cultivation, while the indirect effect is seen in the size of unused natural areas:

The size of unused natural areas corresponds to the total land area minus the agricultural land. Other areas, such as residential, industrial, and infrastructure areas, can be neglected under the assumption that the choice of agricultural system does not have a significant impact on the biodiversity of these areas. By factoring in the relevant influencing variables, the overall biodiversity can then be represented as follows, depending on the desired production quantity:

The area required to achieve the desired production quantity corresponds to the production quantity divided by the surface area productivity of the respective agricultural system. The biodiversity on the agricultural land is equivalent to the product of the agricultural area and the biodiversity per unit of land area, which is characteristic of the specific agricultural system. The unused natural areas result from the difference between the total land area and the required agricultural land. The biodiversity in these areas is determined by multiplying the size of the natural area by the biodiversity per unit of land area, which is characteristic of natural environments. Using the characteristic values for organic farming and conventional farming in this formula, one can unambiguously determine which agricultural system promotes more biodiversity. Based on the above formula, organic farming allows for greater biodiversity than conventional farming, i.e.

if the following inequality holds:

This inequality states that the relative biodiversity gap of conventional farming (left side) must be greater than the relative productivity advantage of conventional farming (right side). In this case, so much biodiversity is lost on conventional agricultural land compared to organic agricultural land that the lower land consumption resulting from higher surface area productivity in conventional farming cannot compensate for it. The inequality also shows that if there is continuous technological progress in a technology-open agricultural system such as conventional farming, there can be a continuous increase in surface area productivity. In turn, this can lead to higher overall biodiversity in the long term compared to organic farming, which is technologically constrained. Whether this inequality holds in the current state of technology can only be determined empirically by inserting the corresponding empirical values of the four variables into the formula above.
In principle, this inequality can be used to compare the overall biodiversity effect of all possible agricultural systems. For example, one could assess the impact of individual measures, such as a 20% reduction in fertilizer use (CAP Goal 13) or a 50% reduction in "dangerous pesticides" (CAP Goal 6), on the overall biodiversity of otherwise conventionally managed areas. However, to do so, the corresponding values of the four variables influenced by the choice of agricultural system first need to be determined empirically for each measure. Currently, these values are unknown. Consequently, the EU's agricultural policy, which claims approximately 30% of the EU's total budget, cannot be assessed in regard to its actual biodiversity impact. It is unknown whether the policy will lead to an increase or decrease in overall biodiversity.
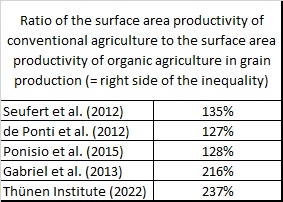
However, for a preliminary comparison of the overall biodiversity effect of organic and conventional farming, some key metrics can be found in the empirical literature. Three meta-studies ( de Ponti et al., 2012; Seufert et al., 2012; Ponisio et al., 2015) have determined the average values of land productivity for conventional and organic farming based on a large number of individual studies. When these values are plugged into the right hand side of the inequality, the following percentages are obtained:

However, these studies primarily analyzed experimental data to determine the maximum theoretical production quantity per unit of land. Real-world agriculture, on the other hand, largely operates under market conditions, where producers seek to maximize their profits. There is a significant difference between profit maximization and production quantity maximization. For instance, when pursuing profit maximization, increased use of human labor may not be the first choice to combat pest infestations as human labor is scarce and costly. Therefore, under market conditions, the ability of conventional farming to use pesticides and herbicides provides a productivity advantage to conventional farming. However, on typically small experimental fields where labor can be financed from research budgets, it is easier to fight pest infestations with increased use of labor. As a result, under experimental conditions, the productivity advantage of conventional farming could be lower.
The differences between experimental and real-world farming may explain why the productivity advantage of conventional farming appears significantly larger when comparing the productivity figures of real-world farms, which operate under market conditions. Such a comparison was conducted in a study by Gabriel et al. (2013). This study compared crop yields from 16 conventional farms and 13 organic farms operating under market conditions in the UK. In this study, the ratio of surface area productivity of conventional farming to organic farming in grain production was 216%. A similar magnitude resulted from a data panel maintained by the Thünen Institute since 2011 (Thünen Institut, 2022). This panel records key operational data for 492 organic farms and 2140 conventional farms in Germany. When averaging the results of this panel over the period from 2011 to 2021, the ratio of surface area productivity of conventional farming to organic farming in grain production is 237%. In other words, the surface area productivity of conventional farms is 137% higher. To put it differently, to produce the same quantity of grain as an organic farm, an average conventional farm in the Thünen panel only requires 42% of the surface area of an average organic farm (calculation).
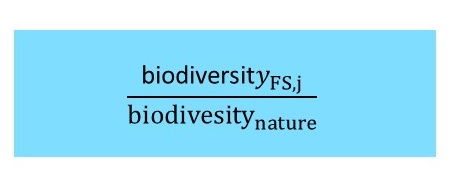
Metrics for comparing the biodiversity gaps between conventional and organic farming (left side of the inequality) can be found in studies by Keeling et al. (2012) and Reidsma et al. (2006). These studies measure the biodiversity of an agricultural system using the Mean Species Abundance (MSA). The MSA corresponds to the average proportion of the number of species found in a specific agricultural system to the number of those species in an equally sized natural area. Only species present in the natural area are considered. Therefore, the MSA dimension represents biodiversity in the area of a particular agricultural system j compared to biodiversity in an equally sized natural area:

The MSA indicates the average percentage of the various species found on the surface area of the farming system compared to their presence in the wild on a surface area of the same size. Consequently, subtracting this value from 1 gives the proportion of species that have disappeared from the farming system compared to the natural environment. This value is therefore referred to as the Potentially Disappeared Fraction (PDF):

As this notation of the PDF for an agricultural system j indicates, dividing the PDF value of conventional farming by the PDF value of organic farming yields a ratio value that corresponds to the left side of the inequality:

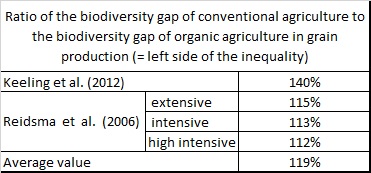
The study by Keeling et al. (2012) determined MSA values using data from an agricultural farm study in the UK (UK Farm Business Survey, 2013). According to their findings, the biodiversity gap in conventional farming amounts to 140% of that in organic farming. The study by Reidsma et al. (2006) calculated MSA values for both agricultural systems across three different intensity levels. In this context, "extensive" is defined as a production factor input of up to 80 euros per hectare, while "highly intensive" refers to a production factor input of at least 250 euros per hectare. The intermediate intensity level, "intensive", falls between these values. The resulting values for the biodiversity gap are 115% for extensive farming, 113% for intensive farming, and 112% for highly intensive farming. These values clearly indicate that the relative biodiversity advantage of organic farming decreases with increasing farming intensity.

The results for the relative biodiversity gap of conventional farming (left side of the inequality) can be compared with the results for the relative productivity advantage of conventional farming (right side of the inequality). The organic farming system only exhibits higher overall biodiversity when comparing the relative biodiversity gap of conventional farming according to Keeling et al. (2012) with the relative productivity advantages of conventional farming based on experimental data (de Ponti et al., 2012; Seufert et al., 2012; Ponisio et al., 2015). However, a comparison with the productivity advantage of conventional farming from real-world farms (Gabriel et al., 2013; Thünen Institut, 2022) shows that even the relatively high biodiversity gap of conventional farming reported by Keeling et al. (2012) falls lower than the productivity advantage of conventional farming.
The following diagram illustrates the result for the case of a relative productivity advantage of conventional agriculture of 237%, where a conventional farm only requires 42% of the acreage of an organic farm. This implies that under conventional farming, the same production quantity as in organic farming could be produced in an area that is 58% smaller. The non-farmed area could then serve as a natural habitat with a correspondingly high level of biodiversity. This option would be weighed against the slightly higher biodiversity on the organically managed agricultural land.
Given these results, the EU Commission's current strategy of promoting extensification is highly questionable as it solely focuses on the direct biodiversity impact on the area under cultivation while neglecting the indirect biodiversity impact on the required land. Currently, EU production accounts for 18% of global wheat production, 36% of barley production, and nearly 60% of rye production (FAO data). If the EU reduces its contribution to global grain production through the described extensification measures, this will lead to price increases on globally interconnected agricultural markets, creating strong incentives for the expansion of agricultural production areas outside the EU. The resulting habitat loss will likely lead to a decline in biodiversity outside the EU. Consequently, there exists a global trade-off between biodiversity within the EU and biodiversity outside the EU — a conflict that the EU agricultural policy should be aware of. It is therefore necessary to collect the productivity and biodiversity indicators needed to estimate the overall biodiversity impact of agricultural policy. Without these data, EU agricultural policy is flying blind.